Figure 1. Initial Factor loading of PDS Indices for Boys
Figure 2. Final factor loading of PDS Indices for Boys
Puberty in Boys: A Complex Phenomenon Unwind from Pakistan
Maryam Amjad* and Amina Muazzam
Lahore College for Women University
In order to explore puberty stages in teenage boys, the indices for boys in the Pubertal Development Scale (PDS, Carskadon & Acebo, 1993) were adapted to Urdu and 1344 participants aged 10-18 years were recruited from the different schools of Lahore, through convenient sampling. A four factor model fit with satisfactory internal consistency of items and inert-factor correlations was reported. The pubertal category scores have overlapping categories of pubertal stages that are comparable to the gold standard of Tanners stages. The findings suggest that the assessment of secondary sexual characteristics through PDS is quite subjective to rate for the children especially when the target population has low level of awareness and knowledge about them. Implications are discussed in the light of the findings.
Keywords: puberty; teenage boys; pubertal development.
During the evolution phase from infancy to sexual development, a series of neuro-endocrine variations is involved to acquire puberty (Dorn et al., 2006; Grumbach, 2002). For pubertal growth and maturity, one may not find the age a good predictor as far as the pubertal timing is concerned. Moreover there are always individual and gender differences along with the progress and pace to gain complete maturity of sexual characteristics that usually and broadly depend on the heredity, culture and race, nutrition as well as mental and societal elements (Dorn et al., 2006; Marceau et al., 2011; Rogol et al., 2002). Therefore, it is vital to investigate the inception and progress of puberty in order to diagnose certain diseases that might disturb the course of development (Dorn et al., 2006; Rockett et al., 2004). Moreover, while investigating several bio-psycho-social influences, one needs to comprehend adolescence in its true sense.
Tanner’s scale is called the most famous benchmark to assess puberty, categorizing it into five progressive phases (Marshall & Tanner, 1969 & 1970) that take place autonomously (Dorn et al., 2006) i) form and size of genitalia in boys and breasts in girls that basically reveal the aligned activities of hypothalamic, pituitary, and gonadal hormones (Grumbach, 2002); and the pubic hair growth and spread in both genders indicating the production of steroids because of the adrenal cortex development (Rege & Rainey, 2012). Qualified and trained pediatrician can perform physiological checkup for the Tanner’s stages. But engaging such an expert along with an appropriate investigative setting are quite costly and seldom possible, particularly for a large study sample (Dorn et al., 2006). A substitute assessment technique in the form of the Pubertal Development Scale (PDS), originally developed by Petersen et al (1988) and further refined with scoring by Carskadon and Acebo (1993), was anticipated to outwit these shortcomings. PDS is a short self-evaluating measure consisted of five statements that investigate for the secondary sexual characteristics occurring in the body during puberty, gauging the physical as well as neuro-endocrinal progress in this period (Akcam et al., 2004; Berg et al., 2006; Ceruti et al., 2018; Randall, 2008). This is a simplest scale without any images of the genitals or puberty stages diagrams and there is no need of any physical examination. Therefore, PDS has been proved to have wide utility due to its undemanding and cheaper administration as compared to Tanner ranking, being extensively used in different settings and samples (Dorn et al., 2006). In addition, PDS measures hereditary and unrevealed ecological elements that affect the development during puberty (Mustanski et al., 2004). It also gauges the connection with the mineral density of bones (Schmitz et al., 2004) and the absorption of adrenal and gonadal hormones (Hibberd et al., 2015; Shirtcliff et al., 2009), even better in some instances in comparison to the clinical investigation (Shirtcliff et al., 2009).
PDS provides sufficient and adequate measure of puberty as asserted by its authors Petersen et al. (1988) and Carskadon and Acebo (1993). However, only Carskadon and Acebo (1993) contrasted PDS with the Tanner’s scale and that is only with a small sample, including those limited number of studies that compared PDS scores with the expert doctor’s evaluation, despite the popularity of the PDS. These studies provided internal consistency ranging from dubious to satisfactory (Campisi et al., 2020; Chan et al., 2010; Pompéia et al., 2019). Therefore, the objectives of the current study were a) adaptation of PDS in the local language URDU; and b) determining to what extent this self-assessment tool solely provides pubertal stages corresponding to the original authors’ akin to Tanner staging without a physician involvement.
Method
1337 teenage boys of 10-18 years of ages from different schools of Lahore (Pakistan), were selected from September 2021 to April 2022 to gauge the incidence of puberty in them. Convenient sampling method was employed as the stratified sampling was not possible due to lack of cooperation from the schools’ administrations due to their policies established during Covid pandemic. As a matter of fact, Lahore is the second largest and most populated metropolitans as well as cosmopolitans of Pakistan with around eight million population. Lahore’s population has grown rapidly since 1998 to 2013 on 2% growth rate (3.41% in 2022) and the city has expanded towards its boundaries of 1772 square kilometers, getting double in the last fourteen years making it 42nd in the list of most heavily populace cities of the world (Pakistan Bureau of Statistics, 2022). The expected population of male adolescents enrolled in the middle and high schools aged 10-19 years, only in Lahore is more than 44000 where the 35000 boys are getting formal education, distributed in the five districts of Lahore, as reported by the School Information System (Government of the Punjab, 2023). Therefore, several private and public schools all over Lahore were contacted and the data was collected where the administrations cooperated and allowed.
For the study, the age range was set to be 10-18 years of adolescent boys according to the current literature. Therefore, the grades chosen in the schools were 4-10 considering the minimum comprehension level and the ages spread over these grades. While following all the SoPs for Covid-19 and ethical considerations, prior approval was taken from the heads of the institutes. The school authorities as well as the research participants were informed about the aims and the objectives of the research and they were ensured for the confidentiality of their identity. The forms were filled by the participants in a group setting in different grades, with the cooperation of two trained research assistants. Most of the schools’ administrations in private sector did not allow nor cooperated for the data collection. For example, they objected on asking the questions from the boys especially the hair growth in armpits and pubic area considering it a social taboo, embarrassing for the children, and parents may retaliate if they got to know about it, etc. For this, they were counseled and convinced by explaining the significance and repercussion of the topic although many still disagreed and refused straightly. Taking in mind these constraints, therefore, special permission from the District Education Authority (DEA) Lahore was sought, in order to gather the data smoothly but it was only for the public sector schools. A vetted list of Boys’ Public Schools of Lahore was taken from the DEA office and ten schools among 185 boys’ schools around the city were selected on the basis of convenience.
Boys within the age range of 10-18 years were collected to provide responses according to their current growth. The small children in the lower age range were assisted by the trained research assistants to give answers of the questionnaire as our objective was to study the most accurate self-assessment of pubertal development, along with puberty onset and stage. 1344 questionnaire could be filled completely and no form was received incomplete or discarded. With the help of date of birth and date of test administration, the ages of the children were rounded off with the approximate age year i.e., previous year with less than 6 months and next year with more than 6 months. After data collection, all the protocols were assigned a number for reference identification and data entry in the latest version of SPSS-23 software.
Assessment Measures
The measure Pubertal Development Scale (PDS) was originally developed by Petersen et al. (1988) and refined by Carskadon and Acebo (1993) into self-reporting style, for ages 11-17 years old adolescent boys and girls. Although, the tool has been used in Pakistan already at different places but due to the unavailability of the translated version, adaptation protocols were followed. Indices for boys were intended to use hence translated and back translated by 5 English and Urdu Language Experts. The language and words were chosen to be easiest to comprehend by all age ranges included in the sample. PDS is comprised of five statements for each gender. For boys, the statements are about increase in height, hair growth in armpits and pubic area, variations in skin type, voice thickening, and hair growing on face. Responses were obtained on a 4-point rating i.e., 1 for “has not yet started” to 4 for “development seems completed”. The mean of the full-scale score indicates the status of puberty to categorize the teens into five sub-groups of puberty i.e., 3 for pre-pubertal; 4-5 for early-pubertal but with no 3 point response; 6-8 score for mid-pubertal and with no 4 point response; 9-11 for the late-pubertal stage; and 12 for post-pubertal stage. According to Crockett et al. (1988), the point values are taken as average for all the items in PDS.
Results
The sample for the study was chosen using the Comrey and Lee (1992) technique, which states that a sample size of 1000 or more is ideal. The results show that the Kaiser-Meyer-Olkin test for sampling adequacy (KMO test) helped the sample adequacy with a remarkable value of.748 to execute a Young and Pearce principal-component factor analysis (2013). Also, the Bartlett's test of sphericity yielded a significant result with a Chi-square value of 967.932 (P=.001), establishing a suitable data distribution for the examination of potential component creation (Table 1). The Scree plot criterion was used for additional confirmation. As there were more than 200 participants in the study, this condition also supports the use of the Scree plot (Cattle, 1978). Before beginning the additional studies on the data, seven extreme outliers were deleted.
Table 1
KMO and Bartlett Tests for the Pubertal Development Scale (N=1337)
|
Scale |
KMO |
Bartlett’s Test |
df |
p |
|
PDS |
.748 |
967.932 |
6 |
.000*** |
Note: p=>.001
Table 2
Demographic information of the study participants (N=1337)
|
Variable |
f (%) |
M (SD) |
|
Age |
|
14.20(2.23) |
|
10 |
68(5.1) |
|
|
11 |
112(8.4) |
|
|
12 |
175(13.1) |
|
|
13 |
164(12.3) |
|
|
14 |
184(13.8) |
|
|
15 |
201(15) |
|
|
16 |
181(13.5) |
|
|
17 |
176(13.2) |
|
|
18 |
76(5.7) |
|
|
Grade |
|
7.91(1.88) |
|
4 |
56(4.2) |
|
|
5 |
151(11.3) |
|
|
6 |
148(11.1) |
|
|
7 |
160(12) |
|
|
8 |
162(12.1) |
|
|
9 |
313(23.4) |
|
|
10 |
347(26) |
|
|
School Sectors |
|
|
|
Govt/Public |
950(71.1) |
|
|
Private |
387(28.9) |
|
|
Height |
|
|
|
10 |
|
4.06(4.88) |
|
11 |
|
4.36(0.49) |
|
12 |
|
4.52(0.49) |
|
13 |
|
4.77(0.49) |
|
14 |
|
4.95(0.35) |
|
15 |
|
5.08(0.33) |
|
16 |
|
5.12(0.26) |
|
17 |
|
5.10(0.32) |
|
18 |
|
5.11(0.35) |
|
Weight |
|
|
|
10 |
|
30.24(7.31) |
|
11 |
|
37.70(7.21) |
|
12 |
|
40.64(8.97) |
|
13 |
|
44.25(11.15) |
|
14 |
|
48.79(10.58) |
|
15 |
|
54.19(12.52) |
|
16 |
|
57.76(12.53) |
|
17 |
|
57.36(11.06) |
|
18 |
|
58(9.40) |
|
BMI |
|
|
|
10 |
|
20.16(5.38) |
|
11 |
|
21.76(4.85) |
|
12 |
|
21.93(5.91) |
|
13 |
|
21.34(6.19) |
|
14 |
|
21.26(4.55) |
|
15 |
|
22.69(5.37) |
|
16 |
|
23.75(5.17) |
|
17 |
|
23.81(4.67) |
|
18 |
|
24.21(5.62) |
A sample of 1344 participants was chosen via mixed method of sampling from various public, private and semi government boys’ schools of Lahore city. Ten to 18 years aged (M=14.20, SD=2.23) boys were recruited for the data collection that was spread across 4th to 10th grades (M=7.91, SD=1.88) (Table 2). Only boys were included in the sample gathered from the government (21.8%), semi government (49.3%), and private (28.9%) schools of Lahore city. Aims and objectives of the study were debriefed to all the heads of the institutions and study participants in verbal and written manners along with the guidelines to fill the questionnaire. Formal permission from the schools’ principals for data collection and informed consent were sought from the participants before the presentation of study protocols, keeping the ethical considerations on priority. Boys in grade 4 and 5 with age range 10-12 years, provided assistance in marking the right category according to their subjective estimation as well as the examiner’s observation. For the body mass index (BMI), the build and heft of the participants were also measured. No one reported any difficulty in filling the questionnaire.
PDS is an English language scale, developed with 5 items for boys, corresponding to five factors. The factor structure was analyzed through the Confirmatory Factor Analysis (CFA) of the scale. Previously, 5 distinct elements were explored (growth spurt, hair growth on body, changes in skin, changes in voice, and hair growth on face). This scale also provides the puberty stages according to the total score of all the 5 items/factors.
Investigating the factors is a vigorous approach to the normality assumption (Fabrigar et al., 1999). Therefore, skewness as well as kurtosis were calculated to gauge the univariate normality (Peat & Barton, 2005). Seven extreme outliers in the data were discarded. Correlation being more than .30 value of each factor indicated that the data is fit for the analysis of factor (Coakes & Steed, 2003). CFA was applied to confirm the previous factor building of the Pubertal Development Scale (PDS) by using AMOS-23. Values of the model chi-square, RMSEA, SRMR, and the CFI are enough for the Structural Equation Models (SEM) as recommended by Kline (2015) or chi-square test, RMSEA, CFI or TLI, and SRMR (Hu & Bentler, 1999; Schermelleh-Engel et al., 2003) figures should be taken for a model fit.
Table 3
Initial Model Fit indices of the Pubertal Development Scale (N = 1337)
|
Models |
X2 |
|
df |
X2/df |
CFI |
TLI |
RFI |
SRMR |
RMSEA |
CR |
AVE |
|
Initial Model |
31.317 |
|
5 |
6.263 |
.979 |
.96 |
.95 |
.035 |
.063 |
.74 |
.36 |
|
Model Fit (First order) |
.964 |
|
2 |
.482 |
1.00 |
1.00 |
.99 |
.007 |
.000 |
.72 |
.39 |
***p<0.001
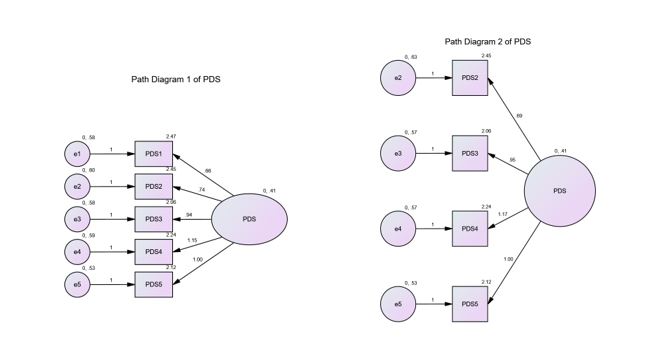
To establish the psychometric properties of PDS, CFA was carried out (Table 3). The construct of the scale was validated along with the factors’ reliability. The initial model fit indices of CFA in the Table 3 demonstrate the value of χ² (5, 1337) =6.263, p < .001 indicated a terrible fit as the chi square values should be in between 1-3 (Hu & Bentler, 1999). A good fit is indicated by the value of chi-square, while considering the sample size and its spread to be sensitive to this estimation. Besides, there are other comparative fit indicators that are emphasized by the statistics experts in order to calculate complete model fitting to the data. In comparison, the next model fit has excellent chi square values χ² (2, 1337) = .482, p > .05 making it the absolute model fit. For this model the first item of the scale was removed on recommendation that helped to acquire all the other values suitable for the model fit (Figure 1, Figure 2).
The value of Standardized Root Mean Square Residual (SRMR) is the corresponding disparity between the experimental and expected correlations, hence provide outright estimate of fit. A suitable fit is mainly counted with an estimate lower than .08 (Hu & Bentler, 1999). In both models the values of SRMR (.035 and .007 respectively) are excellent and less than .08, but the final model’s SRMR value is closer to zero making it more perfectly fit along with other measures. The Root Mean Square Error of Approximation (RMSEA) provide a stringently modified indicator of model fit. A suitable fit is usually nearer to zero and the acceptable value should be < .08 or < .05. Moreover, the p-value with RMSEA should not be significant. The initial model declared RMSEA with .063, p= .138 that is within the acceptable range but the final model presented excellent value of RMSEA with .000, p=.973, proving it to be an excellent fit (Schumacker & Lomax, 2004). The 0.95 estimate of (Non) Normed Fit Index (NFI) corresponds to the relevant model to be improving the fit by 95%. NNFI, also known as the Tucker Lewis Index (TLI) should be > .90 (Byrne, 1994) or > .95 (Schumacker & Lomax, 2004). The value of TLI in both models are higher (.96 and 1.00 respectively) but the final model explains its TLI more fit for itself, yet aiding the other model fit values. Comparative Fit Index (CFI) is an amended mode of NFI that is not restrained to the size of the sample (Fan et al., 1999), contrasting the present data with the assumed model and accommodating the sample size problems in the chi-square as well as the NFI values. CFI ideal value is > .90, while ranging from zero to one. In our both models, the initial CFA analysis provided .979 and the final model gave the absolute value of 1.00. Therefore, while taking the other assumptions and measures, we will take the final model value of CFI as an excellent fit for it. Furthermore, Relative Fit Index (RFI) close to 1 denotes a good fit while again ranging from 0-1. Hence, the final model fit with RFI=.99 provides another value of excellent fit (Schumacker & Lomax, 2004).
The CFA also provides composite or convergent reliability (CR) of the scale for the internal consistency of the items and its value is linked with the Average Variance Extracted (AVE = >0.50). Reliability can be determined with only CR because of the stringent AVE most of the time (Malhotra & Dash, 2011). If CR is greater than 0.6 then the AVE equivalent to 0.4 may be acceptable for the specific construct (Aibinu et al., 2011; Hair et al., 2017). For the reliability of each item, loading estimates greater than 0.5 are considered to be significant (Aibinu et al., 2011). All these value ranges are acquired sufficiently for the final model fit. Thus, these indicators had been satisfactory to generalize the model on the verified data and adequately precise for the model fit as displayed in the following figure.
|
|
|
Figure 1. Initial Factor loading of PDS Indices for Boys |
Figure 2. Final factor loading of PDS Indices for Boys |
Table 4
Inter-Correlation Estimates, Means and Standard Deviation for the Four Subscales and Total Score of Pubertal Development Scale (N= 1337)
|
Scale |
PDS2 |
PDS3 |
PDS4 |
PDS5 |
PDS_Tot |
α |
|
PDS2 (hair growth on body) |
- |
.32*** |
.35*** |
.31*** |
.70*** |
.80 |
|
PDS3 (skin change) |
- |
- |
.44*** |
.42*** |
.52*** |
.81 |
|
PDS4 (voice change) |
- |
- |
- |
.47*** |
.81*** |
.76 |
|
PDS5(hair growth on face) |
- |
- |
- |
- |
.78*** |
.78 |
|
PDS_Tot |
- |
- |
- |
- |
- |
.84 |
|
M |
2.45 |
2.06 |
2.24 |
2.12 |
6.80 |
|
|
SD |
0.91 |
0.97 |
1.07 |
0.97 |
2.26 |
|
**p< 0.001
Table 4 indicates substantial positive correlation among all the items of PDS along with reliable range of Cronbach Alpha from76-84 (α = >.70), explaining the internal consistency of the items. All the four items of the scale are well correlated with the total score of the PDS, endorsing the connection and strength of the construct of the scale.
On the basis of the current literature, following questions were taken into consideration in order to get an approximate idea of puberty among teen boys i.e. what is the age bracket of puberty in Pakistani boys and what are the different puberty stages of adolescent boys in Pakistan?
Table 5
Descriptive statistics of the total score of the three items of Pubertal Development Scale (PDS) of the boys across ages (N=1,337)
|
Age in years (n) |
Mean (95% CI) |
Min-Max |
PCS With Mean% of the Responses on 3- & 4-Point scores |
|
|
PDS2: Sum of 3 items |
|
|
|
10 (68) |
3.62 (3.37, 3.86) |
3-6 |
Pre to early puberty (one 3- point response on item 2) |
|
11 (112) |
4.82 (4.56, 5.09) |
3-8 |
Mid Pubertal (11.6% 3-point & 4.5% 4-point responses on item 2) |
|
12 (175) |
5.36 (5.15, 5.57) |
3-9 |
Mid Pubertal (18.87% 3-point & 5.17% 4-point responses) |
|
13 (164) |
6.06 (5.77, 6.35) |
3-10 |
Mid Pubertal (28.67% 3-point & 4.07% 4- point response) |
|
14 (184) |
6.83 (6.56, 7.09) |
3-12 |
Mid-puberty (33.87% 3-point & 8.67% 4-point response) |
|
15 (201) |
7.72 (7.44, 7.99) |
3-12 |
Late-puberty (38.8% 3-point & 16.57% 4-point responses) |
|
16 (181) |
8.20 (7.93, 8.48) |
4-12 |
Late-puberty (44.57% 3-point & 20.26% 4-point responses) |
|
17 (176) |
8.35 (8.07, 8.62) |
3-12 |
Late-puberty (42.6% 3-point & 23.3% 4-point responses) |
|
18 (76) |
8.13 (7.64, 8.62) |
4-12 |
Late to Post-puberty (33.3% 3-point & 26.77% 4-point responses) |
Table 6
Computation of Pubertal Categories Scores (Petersen et al., 1988)
|
Tanner staging |
PDS C-Scores |
|
1. Pre pubertal |
3 points |
|
2. Early pubertal |
4–5 points (with no 3-point answers) |
|
3. Mid pubertal |
6–8 points (with no 4-point answers) |
|
4. Late pubertal |
9–11 points |
|
5. Post pubertal |
12 points |
Table 5 is showing an overlapping trend of acquiring pubertal stages according to the scoring explained by different authors. It is worth mentioning that several studies provide reference of Carskadon and Acebo (1993) as they established the items and scoring of PDS initially, based on the published research by Petersen and fellows (1988). Therefore, we utilized two most useful methods of scoring (Carskadon & Acebo, 1993; Chan et al., 2010; Pompéia et al., 2019): a) PDS2 (total scores obtained from the 3 sex-restricted questions: changes in voice, hair growth on body and face; and b) Puberty Category Scores (PCS, Chan et al., 2010) from the similar items to compute PDS2 transformed into the phases parallel to Tanner stages. In Table 6, the Tanner Stage overview of pubertal stage is also given for comparison with the PCS.
Table 5 shows 95% confidence interval that corresponds to the minimum to maximum scores at every age and stage in the current population of boys. Based on the percentages of the 3 and 4-point scores attained by the participants, the PCS is derived from pre-puberty to post puberty. Considering the gradually rising percentages of the 3- and 4- point ratings overall on each item are observed quite overlapping on each puberty stage. Therefore, the 10-year age may be considered the pre-puberty to early puberty stage in the target population, as the secondary sexual characteristics are hardly visible and observed at this age and may appear while the boys have no idea of their appearance. From 11 to 12 years of age, the participants’ mean scores show the quick jump from early to mid- puberty stage where the secondary sexual attributes start visible signs to some extent. The age range 11-14 years may be called a transition age from mid- to late puberty where the hardly visible features may get prominent and more observable, hence proved by the percentage of 4-point rating. The 4-point rating at these ages may be due to over estimation too as the boys usually are unaware of whether the change is completed or still to be continued. This rating is gradually increased till the age of 18 years where 3-point rating is gradually decreasing and the 4-point scoring percentage on all the items is increasing. This trend throughout these years make them the convincingly late to post-pubertal stages. However, the scores on each item needs to be considered in order to explain and clarify the present stage of a participant. The last post-pubertal stage at the age of 18 years seems to begin with the variation of secondary sexual characteristics in each individual. Nevertheless, the estimation of acquiring the sexual maturity completely according to the ratings in the scale may not be accurate enough as the participants had been the only raters of themselves. Therefore, considering the confidence interval of 95% on PDS2, the total scores are highly comparable to the gold standard of Tanner’s stages.
Discussion
The Urdu adapted version of PDS for boys is found to be a valid and reliable self-measuring scale with Pakistani teenage boys that can grasp the puberty related changes overall very well. The construct validity confirmed 4-factors model with acceptable convergent validity along with significant inter-item correlation and cronbach alpha. All the scores and analyses are well supported by the previous old and latest studies. Earlier studies where the PDS was adapted from its original form in English language (Petersen et al.,1988; Carskadon & Acebo, 1993) to other languages like Spanish (Siegel et al., 1999), Norwegian (Wichstrøm, 1999), Finnish (Dick et al., 2001), French (Verlaan et al., 2001), German (Randler et al., 2009), Chinese (Chan et al., 2010), and Portuguese (Pompéia et al., 2019), showed variable internal consistencies for male puberty scores. Several studies did not even acquire the lowest cronbach alpha (e.g., Chan et al., 2010) and that may be due to the smaller sample size in all of them and an uneven age distribution. While, in the current study it was the first time that the sample size was larger than ever and with maximum age groups (α = .76 to .81 for the items/factors, PDS full scale α = .84).
Despite the limitation of another rater, the scores may be comparable to the gold standard Tanner Staging. Puberty is all about physiology and its assessment is more subjective than objective as many teens as well as their parents in Pakistan are not ready for the physical assessment from a clinician until they encounter any medical issue. This phenomenon has been, not only, experienced in the current study where several school managements refused to cooperate for even this self-measuring rating scale, but this has been found in other studies of puberty assessment e.g., Shirtcliff et al. (2009) with the multiple ethnic sample. All the scoring procedures have their pros. Nevertheless, the full score of PDS includes more pubertal variations and might provide an enhanced measure of changes in the teens’ bodies, still the three items for category of pubertal staging provide exact sex related responses. Further, the PDS is a measure that anticipates the pubertal variations that one may not find in Tanner stages for example height growth (Rogol et al., 2002) and changes in skin in both boys and girls (Ceruti et al., 2018) and hair growth on face (Randall, 2009) as well as change in voice in boys (Akcam et al., 2004). Also, this self-measure provides the perception and insight about one’s own self when they themselves are focusing their physical appearance and self-esteem particularly (Dorn et al., 2006).
A local study by Karim and Afzal (2009) with 234 boys with the ages 8-18 yrs altogether and with only physical examination by expert clinicians explained an earlier switching to the Tanner stage 2 i.e., early puberty. This study supports our current study’s results too where the scores of PCS also exhibited a speedier trend of attaining early puberty and then very soon to mid-puberty transition. In fact, the ratings of 3 and 4 points are quite less defined where children may not have the idea of the continuous and complete development of a sexual characteristic. For more accurate rating, the participants should be properly educated about the changes they may have during their teen age and then these self-assessment scales would provide more valid and reliable estimates about their puberty. Inclusion of genital growth and idea of spermarche in the PDS may provide even better evaluations of the puberty without a physical checkup, as these two things are few of the most significant bio-indicators of puberty in boys.
The exclusion of the two items that are about growth of height and changes in skin i.e., pimples and darkening, are due to the fact that these are not sexual maturity measures actually. Because the increase the height is dependent more on genetics, diet, and sickness etc. Acne on skin is not teenage specific and may have other causes too e.g., unhealthy diet and stomach (Chan et al., 2010).
Implications
The Pubertal Development Scale (PDS) is an important tool for the self-assessment of the physical development of adolescents. Adapting the PDS for Pakistani teenage boys is essential, as it helps to better understand their unique needs and to develop appropriate strategies and interventions that are tailored to their needs. This can help ensure that interventions and supports are culturally appropriate and address the unique challenges faced by young boys in Pakistan. Furthermore, adapting the PDS for the Pakistani adolescent boys can help to identify any potential gaps in service delivery, and ensure that appropriate support is provided to them in Pakistan who are struggling with their pubertal development.
Limitations and suggestions
The sample on both ends of the age ranges i.e., 10 and 18 years is not sufficient as compared to the other age groups. But the spread of ages over the grades in the schools of Pakistan had in past and would always restrict the researchers in future to choose grades over ages. Although, the biological and sexual changes are affected by the ages, but not grades. Adding more data to all the age groups may provide lesser overlapping pubertal category scores. Schools’ administration may be educated to take school counselors on board in order to make the children as well as their parents aware of the puberty and its challenges. Knowing and eventually handling these challenges adequately by the teenage boys as well as the people around them would benefit the society in a psychologically and socially healthier ways.
References
Aibinu, A. A., Ling, F. Y. Y., & Ofori, G. (2011). Structural equation modelling of organizational justice and cooperative behaviour in the construction project claims process: Contractors’ perspectives. Construction Management and Economics, 29(5), 463–481. https://doi.org/10.1080/01446193.2011.564195
Akcam, T., Bolu, E., Merati, A. L., Durmus, C., Gerek, M., & Ozkaptan, Y. (2004). Voice changes after androgen therapy for hypogonadotrophic hypogonadism. Laryngoscope, 114(9), 1587–1591. https://doi.org/10.1097/00005537-200409000-00016
Byrne, B. M. (1994). Structural equation modeling with EQS and EQS/Windows. SAGE.
Campisi, S. C., Humayun, K. N., Rizvi, A., Lou, W., Söder, O., & Bhutta, Z. A. (2020). Later puberty onset among chronically undernourished adolescents living in a Karachi slum, Pakistan. Acta Paediatrica, 109(5), 1019–1025. https://doi.org/10.1111/apa.15053
Carskadon, M. A., & Acebo, C. (1993). A self-administered rating scale for pubertal development. Journal of Adolescent Health, 14(3), 190–195. https://doi.org/10.1016/1054-139x(93)90004-9
Ceruti, J. M., Leirós, G. J., & Balañá, M. E. (2018). Androgens and androgen receptor action in skin and hair follicles. Molecular and Cellular Endocrinology, 465, 122–133. https://doi.org/10.1016/j.mce.2017.09.009
Chan, N. P., Sung, R. Y., Nelson, E. A. S., So, H. K., Tse, Y. K., & Kong, A. P. (2010). Measurement of pubertal status with a Chinese self-report pubertal development scale. Maternal and Child Health Journal, 14(3), 466–473. https://doi.org/10.1007/s10995-009-0481-2
Coakes, S. J., & Steed, L. G. (2003). Analysis without anguish using SPSS Version 11.0 for windows. Milton, Queensland: John Wiley & Sons.
Comrey, A. L & Lee, H. B. (1992). A First course in factor analysis. Hillsdale, NJ: Erlbaum.
Dick, D. M., Rose, R. J., Pulkkinen, L., & Kaprio, J. (2001). Measuring puberty and understanding its impact: A longitudinal study of adolescent twins. Journal of Youth and Adolescence, 30(4), 385–399. https://doi.org/10.1023/A:1010471015102
Dorn, L. D., Dahl, R. E., Woodward, H. R., & Biro, F. (2006). Defining the boundaries of early adolescence: A user’s guide to assessing pubertal status and pubertal timing in research with adolescents. Applied Developmental Science, 10(1), 30–56. https://doi.org/10.1207/s1532480xads1001_3
Fabrigar, L. R., Wegener, D. T., Maccallum, R. C., & Strahan, E. J. (1999). Evaluating the use of exploratory factor analysis in psychological research. Psychological Methods, 4, 272-299.
Fan, X., Thompson, B., & Wang, L. (1999). Effects of sample size, estimation method, and model specification on structural equation modeling fit indexes. Structural Equation Modeling: A Multidisciplinary Journal. Structural Equation Modeling, 6(1), 56–83. https://doi.org/10.1080/10705519909540119
Government of the Punjab. (2023). Online school information system – School education department. https://sis.punjab.gov.pk/dashboard
Grumbach, M. M. (2002). The neuroendocrinology of human puberty revisited. Hormone Research in Paediatrics,57, Suppl. 2, 2–14. https://doi.org/10.1159/000058094
Hair, J. F., Hult, G. T. M., Ringle, C. M., & Sarstedt, M. (2017). A primer on partial least squares structural equation modeling (PLS-SEM) (2nd ed). SAGE, Inc.
Hibberd, E. E., Hackney, A. C., Lane, A. R., & Myers, J. B. (2015). Assessing biological maturity: Chronological age and the pubertal development scale predict free testosterone in adolescent males. Journal of Pediatric Endocrinology and Metabolism, 28(3–4), 381–386. https://doi.org/10.1515/jpem-2014-0187
Hu, L., & Bentler, P. M. (1999). Cutoff criteria for fit indexes in covariance structure analysis: Conventional criteria versus new alternatives. Structural Equation Modeling, 6, 1–55.
Karim, A., & Afzal, M. N. (2009). Pubertal development and growth among boys in a sample of local Pakistani population. Acta Endocrinologica, 5(2), 165–175. https://doi.org/10.4183/aeb.2009.165
MacCallum, R. C., Browne, M. W., & Sugawara, H. M. (1996). Power analysis and determination of sample size for covariance structure modeling. Psychological Methods, 1(2), 130–149. https://doi.org/10.1037/1082-989X.1.2.130
Malhotra, N. K., & Dash, S. (2011). Marketing research an applied orientation. Pearson Publishing.
Marceau, K., Ram, N., Houts, R. M., Grimm, K. J., & Susman, E. J. (2011). Individual differences in boys’ and girls’ timing and tempo of puberty: Modeling development with nonlinear growth models. Developmental Psychology, 47(5), 1389–1409. https://doi.org/10.1037/a0023838
Marshall, W. A., & Tanner, J. M. (1969). Variations in pattern of pubertal changes in girls. Archives of Disease in Childhood, 44(235), 291–303. https://doi.org/10.1136/adc.44.235.291
Marshall, W. A., & Tanner, J. M. (1970). Variations in the pattern of pubertal changes in boys. Archives of Disease in Childhood, 45(239), 13–23. https://doi.org/10.1136/adc.45.239.13
Mustanski, B. S., Viken, R. J., Kaprio, J., Pulkkinen, L., & Rose, R. J. (2004). Genetic and environmental influences on pubertal development: Longitudinal data from Finnish twins at ages 11 and 14. Developmental Psychology, 40(6), 1188–1198. https://doi.org/10.1037/0012-1649.40.6.1188
Petersen, A. C., Crockett, L., Richards, M., & Boxer, A. (1988). A self-report measure of pubertal status: Reliability, validity, and initial norms. Journal of Youth and Adolescence, 17(2), 117–133. https://doi.org/10.1007/BF01537962
Pompéia, S., Zanini, G. D. A. V., Freitas, R. Sd, Inacio, L. M. C., Silva, F. Cd, Souza, G. Rd, Vitalle, M. S. D. S., Niskier, S. R., & Cogo-Moreira, H. (2019). Adapted version of the Pubertal Development Scale for use in Brazil. Revista de Saúde Pública, 53, 56. https://doi.org/10.11606/s1518-8787.2019053000915
Randall, V. A. (2008). Androgens and hair growth. Dermatologic Therapy, 21(5), 314–328. https://doi.org/10.1111/j.1529-8019.2008.00214.x
Randler, C., Bilger, S., & Díaz-Morales, J. F. (2009). Associations among sleep, chronotype, parental monitoring, and pubertal development among German adolescents. Journal of Psychology, 143(5), 509–520. https://doi.org/10.3200/JRL.143.5.509-520
Rege, J., & Rainey, W. E. (2012). The steroid metabolome of adrenarche. Journal of Endocrinology, 214(2), 133–143. https://doi.org/10.1530/JOE-12-0183
Rockett, J. C., Lynch, C. D., & Buck, G. M. (2004). Biomarkers for assessing reproductive development and health: Part 1–Pubertal development. Environmental Health Perspectives, 112(1), 105–112. https://doi.org/10.1289/ehp.6265
Schmitz, K. E., Hovell, M. F., Nichols, J. F., Irvin, V. L., Keating, K., Simon, G. M., Gehrman, C., & Jones, K. L. (2004). A validation study of early adolescents’ pubertal self-assessments. Journal of Early Adolescence, 24(4), 357–384. https://doi.org/10.1177/0272431604268531
Schumacker, R. E., & Lomax, R. G. (2004). A beginner’s guide to structural equation modeling (2nd ed). Lawrence Erlbaum Associates.
Shirtcliff, E. A., Dahl, R. E., & Pollak, S. D. (2009). Pubertal development: Correspondence between hormonal and physical development. Child Development, 80(2), 327–337. https://doi.org/10.1111/j.1467-8624.2009.01263.x
Siegel, J. M., Yancey, A. K., Aneshensel, C. S., & Schuler, R. (1999). Body image, perceived pubertal timing, and adolescent mental health. Journal of Adolescent Health, 25(2), 155–165. https://doi.org/10.1016/S1054-139X(98)00160-8
van den Berg, S. M., Setiawan, A., Bartels, M., Polderman, T. J. C., van der Vaart, A. W., & Boomsma, D. I. (2006). Individual differences in puberty onset in girls: Bayesian estimation of heritabilities and genetic correlations. Behavior Genetics, 36(2), 261–270. https://doi.org/10.1007/s10519-005-9022-y
Verlaan, P., Cantin, S., & Boivin, M. (2001). The scale of pubertal development: Validation of the the French-language version of the Pubertal Development Scale. Canadian Journal of Behavioural Science / Revue Canadienne des Sciences du Comportement, 33(3), 143–147. French. https://doi.org/10.1037/h0087136
Wichstrøm, L. (1999). The emergence of gender difference in depressed mood during adolescence: The role of intensified gender socialization. Developmental Psychology, 35(1), 232–245. https://doi.org/10.1037/0012-1649.35.1.232