Construction and Preliminary Psychometric Properties of Perceived Autism Related Stigma by Association Scale
Arooj Zahra Rizwi & *Syeda Shahida Batool
Government College University Lahore
In Pakistan, autism is commonly a misdiagnosed and unheeded health issue. Literature displays that parents of children with autism spectrum disorder experience stigma by association, but it is often ignored in quantitative studies while studying the risk factors of the wellbeing of parents of children with autism spectrum disorder. There is no scale available that measures the phenomenon of stigma by association in the parents of children with autism spectrum disorder. After generations of items by following deductive and inductive methods, and pilot study, the exploratory factor analysis was run on 26 items by involving 359 parents and confirmatory factor analysis was run on 24 items by collecting data of 500 parents from different institutions, platforms and Autism Centers of Punjab. After exploratory and confirmatory factor analyses, 21 items were retained with three well defined factor structure of Perceived Autism Related Stigma by Association Scale (viz., Attitude of community, Behavior of community, and Emotional burden). The Cronbach’s alpha of the subscale of perceived autism related stigma by association ranged from .69 to .82. Further, convergent and discriminant validity of the scale were established by finding its relationship with the Perceived Stigma Scale and Rosenberg’s Self- esteem Scale. Results revealed that the newly developed Perceived Autism Related Stigma by Association Scale has good psychometric properties, which can be used in hospital as a standardized tool for measuring stigma by association in parents of children with autism spectrum disorder.
Keywords: autism, stigma by association, parents, convergent validity, discriminant validity
As we know that the contemporary business realm is exclusively diverse and different from the past. In the business climate nowadays, intangible assets like engagement, knowledge, and retention of talent provide the competitive advantage and tangible assets are not supposed to be as important as they were in the past (Daraei & Vahidi, 2014). In South Africa, Human Capital Trend’s 2014 survey showed that retention and engagement both are the third biggest challenges of talent retention which organizations face (Bersin, 2014). Mabindisa (2013) and Bersin (2014) infers that organizations should shift from “holding” to “attracting and engaging” employees. As per Memon et al. (2014) businesses that recruit and develop human capital will flourish. Nevertheless, in many organizations, the issue of employee inclination to leave the organization irrespective of employers’ actions to retain them, still occurs (Finnegan, Taylor & Frank, 2004). Intentional turnover may be triggered by stress, workplace mistreatment, workplace bullying, and benefits or pay issues (Mabindisa, 2013). This phenomenon is prevalent in collectivist culture like Pakistan as in most of the households people depend on one bread winner that can alter the mental situation of an employee.
Stigma has been characterized as a mark of dishonor which differentiates the person from others. In the context of mental health, it typically involves people as different and use negative labels for identifying them. Stigma leads to mental health problems and is even more harmful for a person who is already facing mental health issues. The unkind words and social rejection devalue the feelings of people experiencing stigma and they isolate themselves (Byrne, 2000; Corrigan & Watson, 2002). In the lives of families having a child with autism, 95percent families reported that they were experiencing different kinds of stigma (Kinnear et al., 2016; Schaall, 2000). Many researchers noted that stigma keeps most of families away from pursing autism diagnoses and treatment, which later on remains untreated, and is misdiagnosed (e.g., attachment disorder) and unreported in the records (Kim et al., 2011). Ali et al. (2012) conducted a systematic review of 20 studies in which they assessed the impact of stigma of having a child with intellectual disability and autism on parents’ wellbeing. The result demonstrated that parents who reported higher scores on stigma had increased stress and burden, and resulted in a poorer psychological wellbeing.
Stigma experienced by the parents of children with special needs for example, autism spectrum disorder (ASD) is an ignored field, though it has very negative impact on the mental health and the quality of relationships of parents. Goffman suggested that it is important to understand the impact of negative stereotypes and behaviors of people diagnosed with mental health issues on the family members and mental health professionals, and this phenomena is called “Associative stigma” (Yanos, 2018; p. 136). It is evident that family members of a diagnosed person were associatively stigmatized being living with a person suffering from mental disorder.
Abusive SupervisorLiao et al. (2019) conducted a literature review of stigma among parents of children with autism. Total 25 studies were identified, where 15 were qualitative, 8 were quantitative and 2 were mixed method studies. They concluded that parents experienced stigma by association which later on developed into affiliate stigma. Further, parents perceived and experienced stigma due to the consequences of child’s autism behavior and their severity of symptoms. They also reported that there was no proper scale to test the stigma by association in parents or in significant others.
Although, there are many tools available measuring stigma in the specific areas such as Internalized Stigma of Mental Illnesses (Boyd et al., 2003), Stigma of Mental Illness (King et al., 2007), Workplace Stigma (Brohan et al., 2012), and Stigma for Chronic Illness (Molina et al., 2012) but scale on stigma by association in the context of having a child with autism is not available. This might be the reason that very few studies focused on ASD in the perspective of parental stress, mental health issues and relationship quality, due to experiencing stigma by association. When examining a variables impacting parents or caregiver’s wellbeing in raising a child with an ASD, stigma by association is a substantial challenge, but it is often neglected (Austin, et al., 2004; Corrigan et al., 2006; Dimitropoulos et al., 2008).
There is a lack of empirical studies available in Pakistan in the context that focused stigma by association among parents of children with ASD. Most of the studies had developed intervention plans for these children but neglected to focus on challenge of stigma by association faced by the parents. Most of the studies are qualitative that reported parents’ experiences of caring a child with ASD and their experience of stigma by association (Ostman & Kjellin, 2002; Vander-Sanden et al., 2014, 2015), but none of the studies assessed the impact of stigma by association quantitatively and one of the reasons might be non-availability of research tools to measure stigma by association. So the present study was undertaken to fill the gap by developing a valid and reliable scale of Autism related Stigma by Association in the indigenous context of Pakistan.
Objectives of the StudyThe objectives of current study were achieved in two independent studies. Study 1 was divided in III phases. In phase I, items pool was generated and committee approach was carried out to choose the items for the scale. To try out these initial items, a pilot study was carried out. In phase II, exploratory factor analysis on the selected items of the scale was run. In phase III, confirmatory factor (CFA) was run to confirm the factor structure obtained from exploratory factor analysis (EFA). In study II, convergent and discriminant validity was established.
Method
Study I: Construction of Tool
Phase 1: Generation of Item Pool and Pilot Study
Phase I was divided into three steps. In step 1, generation of item pool was accompanied and committee approach was used. In step 2, content validity index was obtained to check the relevance and clarity of each item retained in step 1. In step 3, pilot study was conducted to remove the ambiguity, items overlapping and redundancy, and to ensure the comprehensibility of the statements of items.
Step 1: Generation of Item Pool
Initially, a pool of items was generated in Urdu language for the scale of autism related stigma by association. Deductive and inductive approaches by following (Burisch, 1984) guideline were used for generating the list of items by consulting relevant literature on stigma by association and interviewing the parents of children with ASD. A Proforma was developed consisted of 20 questions regarding experiencing stigma in the context of having a child with ASD. Twenty item semi structured interview schedule was prepared and 30 parents (15 mothers and 15 fathers) were individually interviewed. Total 50 items were generated from literature and content of interviews with parents regarding their experiences and perception of the attitude of family members and community and how people behave in the context of having a child with ASD. The obtained item pool was presented to a committee, comprised of 5 subject experts, who were working in the field of test construction (two PhD scholars, one Professor, one assistant professor, and one lecturer) from the Department of Psychology. After the consensus, 42 items were retained on the basis of clarity of statement, concept, and comprehensibility. Further, Likert type response format (1= strongly disagree, 2=disagree, 3=neutral, 4= agree and 5= strongly agree) was decided to balance both sides of neutral responses and to provide sufficient choice to the participant to select the most suitable option for them (Gregory, 2015).
Step II: Item Content Validity through Expert RatingBefore conducting a pilot study, construct fidelity was ensured, and for this purpose, a content validity index (CVI) was obtained to check the relevancy and clarity of each item in the context of stigma by association. After obtaining 42 items by following a committee approach, 5 clinical psychologists were contacted having experience in dealing with autism spectrum disorder and parents of children with ASD. The lists of 42 items were presented to them and they were instructed to read each item carefully and give responses on a 4 point rating scale (1= not relevant and clear, 2= item need some revision, 3= relevant or clear but need minor revision, and 4= very relevant and clear) in terms of clarity and its relevancy. Item content validity index (I- CVI) was computed by dividing the sum of experts’ rating on every item by the total number of experts. Researchers’ recommendations that item content validity index should be .78 to 1(Lynn, 1986) was followed to retain final items for the scale.
Table 1
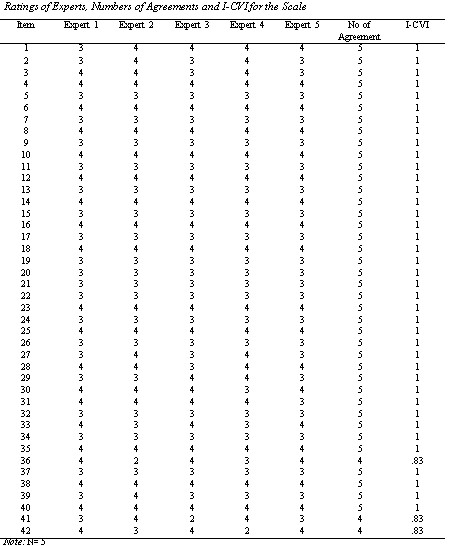
Table 1 shows the rating of items by five professional experts in the field of Clinical Psychology. Most of the experts rated on the scale of 3 to 4 which shows that all the items are relevant and clear. After obtaining, items content validity index, Scale content validity index was also computed by using following formula:
-
S-CVI= Total items CVIs/ Total no of items
-
S-CVI= 41.49/42
-
S-CVI= .98
Step III: Pilot Study
Pilot study was conducted to examine the psychometric cleansing, to avoid the ambiguity, overlapping, redundancy, and to ensure the comprehensibility of statements. A purposive sample (N=60) with equal distribution of parents (30 mothers and 30 fathers) having a child with ASD, already diagnosed, and had no other co morbidities, age ranged from 4 to 12 years old was recruited from different Autism Centers of Punjab (e.g., Lahore, Sheikhupura, Gujranwala, and Faisalabad). Only those parents were involved who were living together. The kolmogorov-Smirnov test of normality was used to check the normality of items as recommended by Hair et al. (2006). In this step, 16 out of 42 items were deleted due to non- normality and redundancy. Some of the items were reported by participants having ambiguity and found difficulty in responding them. So, after committee discussion, item number (2, 6, 7 and 19) were rephrased and modified and item 7 was marked for reverse scoring. Finally, 26 items were selected for the EFA in the subsequent study.
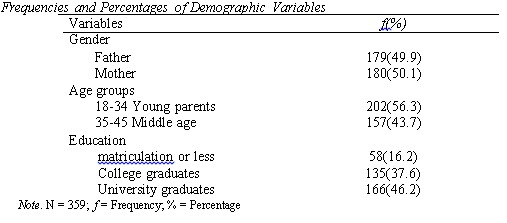
Phase II: Factor Structure and Internal Consistency of the ScaleIt was aimed to establish the factorial validity of the indigenous scale of Perceived Autism Related Stigma by Association in the context of Pakistan. A purposive sample of (N=359) with inclusion of both parents (180 mothers and 179fathers) was recruited from different cities of Punjab. The parents having a child diagnosed with ASD by the clinical psychologists were engaged in the study. Further, both parents were living together and belonged to lower to upper socio economic class.
Table 2
Prior to administration of the scale, parents were approached and were contacted in person, where permission was taken and time was fixed when both parents were available for administrating the scale. After that, consent form was signed and the parents were briefed about the purpose of the study and assured that their responses would be kept confidential and they were not supposed to mention their names on the questionnaire. There was no time limit to fill the questionnaire and it took 15 to 25 minutes to read and respond the items of the scale. They were also requested to feel free to indicate if they felt any ambiguity in the statement of items. Further, they were told that there was no right or wrong answers. Data were analyzed through SPSS 21.0.
Exploratory Factor AnalysisFor assessing the factor structure via EFA, different assumptions were tested based on the sample size, normality of variable scores, outliers cases, suitable correlation matrix which should exceed from .3 and communalities > .5 (Cook & Steed, 2003; Field, 2004). In this study, Kaiser- Meyers-Olkin (KMO) and Bartlett’s test of sphericity were used to test the sampling adequacy (Kaiser, 1974). The achieved KMO (.89) showed that correlations were compact enough to generate distinct and reliable factors with Bartlett test of sphericity (X2 (253) = 3231.1)) significant at p <.001. The skewness and kurtosis were calculated to check the normality of the items and there were no outlier cases. Further, the correlation matrix showed significant correlation between all the items and showed reliable enough for factoring. The communalities on all the items showed good extraction and had significant higher values >.5, so all the items were selected for further analysis
After examining all the assumptions for factor analysis, 26 items were subjected for exploratory factor analysis (EFA). It is used for structuring and reducing the number of items of the scale. Sample was 5 times greater than the total number of items (Field, 2005). Principal component factor analysis (PCA) technique with varimax rotation on the data of 359 parents was used to extract factor structure of Perceived Autism Related Stigma by Association Scale. EFA was run on 26 items, and five factor structure appeared with Eigen value >1.0. For initial three factors solution, loadings were unclear, scattered and had similar loading on more than one factors. After excluding three items due to equal loading on three factors, EFA was again run on remaining 23items. The second model was fixed on three factors as suggested by Scree plot (Cattell, 1966) and it resulted in a clear defined factor structure with most of the items exclusively loaded >.3 on Factor 1, Factor 2 and Factor 3 with Eigen value greater than > 1.0. Further, criterion for the selection of item was set on loading ≥ .30 as a prominent loading on a factor. So the minimum factor loading was .49 and maximum was .74. Finally in the three factor solution, three major forms of perceived autism related stigma by association appeared, ten items were exclusively loaded >.3 on Factor 1, six items exclusively loaded >.3 on Factor 2, and seven items exclusively loaded >.3 on Factor 3. The Eigen value of Factors 1, is 8.23 and rotated sum is 4.7 which explains 20.5 percent variance, the Eigen value of Factor 2, is 1.94 and rotated sum is 3.83 which explains 16.6 percent variance and Eigen value of Factor 3, is 1.44 and rotated sum is 3.07 which explains 13.3 percent variance and together they explain 50.5 percent variance. This shows good cumulative variance as recommended by Beavers et al. (2003). There is no fixed threshold for the value of cumulative variance. Low level of percentage is acceptable in humanities and social sciences (Williams et al., 2012).The scree plot shows that the first three factors account for most of the total variability in data (also apparent in the Eigen values). The Eigen values for the first three factors are all greater than 1.The remaining factors account for a very small proportion of the variability and are likely to be unimportant.
Table 3
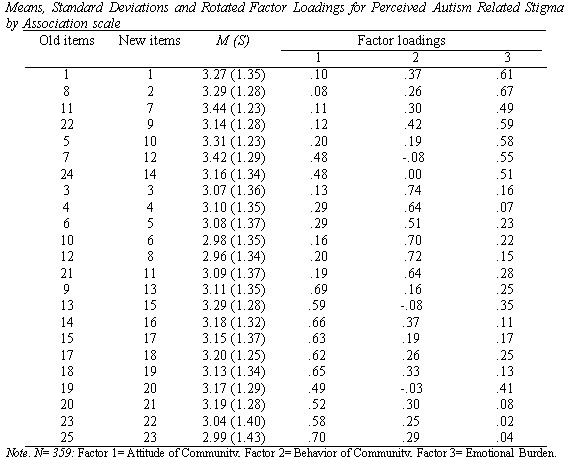
Old items are the item numbers before EFA and the new items are the items retained after CFA. Total three items have been deleted after EFA and two items have been deleted after CFA. So the remaining 21 items are the retained items. We assigned them new numbers, so that item numbers become more understandable for further analysis. A detailed examination of the variables appearing in the obtained three factors reveals that all the three factors are conceptually and theoretically distinctive from each other. All 23 items loaded on the three factors fall in the domain of Perceived autism related stigma by association.
Table 4
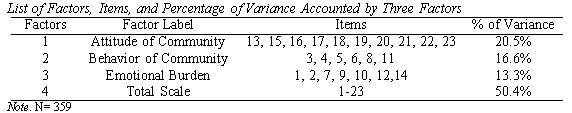
Varimax rotated solution reflected three dimensions of the Perceived autism related stigma by association. Obtained three factors were named as Attitude of community, Behavior of community and Emotional burden. Total variance accounted for by these items is 50.4 percent, which is satisfactory.
The items loaded on Factor 1 (13, 15, 16, 17, 18, 19, 20, 21, 22, 23) have independent loadings and signify the attitude of community (e.g., devaluation of parents for having a child with autism, look down the parents for having a child with ASD, diminish status, etc.). Item loadings on factor 1 explain 20.5 percent of the variance. The sample items of factor one are: Family members and others have turned their backs on me; My friends, relatives and neighbors avoid coming to my place; People get irritated due to different behavior of my child; people and my family members keep their children away from my child.
Items loadings on Factor 2 (3, 4, 5, 6, 8, and 11) have independent loadings and signify the behavior of community towards parents having a child with autism (e.g. character assassination and lowering self-esteem of parents of children with ASD, discredit and distinguish parents for having a child with autism, etc.). Item loadings on factor 2 explain 16.6 percent of the variance. The sample items of factor two are: People show discriminatory behavior; I have stopped going outside and constrain myself due to cynical behavior of people towards me.
TItem loadings on Factor 3 (1, 2, 7, 9 10, 12, and 14) had independent loadings and signify the emotional burden of parents (e.g., feelings of inferiority and helplessness, emotional pain, tension, stress and self-blaming, etc.). Items loadings on factor 3 explain 13.3 percent of the variance. The sample items of factor three are: I feel inferior; when people come to know that my child is autistic, their reaction is painful for me; I blame myself for the condition of my child; I avoid having more children because of the fear of having another autistic child.
Phase III: Confirmatory Factor Analysis (CFA) of Perceived Autism Related Stigma by Association ScaleIt was aimed to confirm the factor structure of the indigenous scale of Perceived Autism Related Stigma by Association. So, the final items of the scale were analyzed by the confirmatory factor analysis. A purposive sample of (N=500) with equal distribution of parents (250 mothers and 250 fathers) was recruited by using a purposive and snow ball technique and Facebook Autism Resources Group. The parents were approached and were contacted in person, permission was taken and time was fixed with both parents for administrating the scale. Only those parents were included who had a diagnosed child with ASD and both parents were living together. For the establishment of the construct validity of the scale, the confirmatory factory analysis by using AMOS version 20.0 was used to ensure the factor structure and dimensionality of the Autism Related Stigma by Association Scale. McDonald and Ringo (2002), reported different indices and criteria for the analysis that was used to describe the best model fit including CFI, GFI, RMSEA, and TLI. Further, Bentler (1990) and Browne et al. (1993) criteria for the interpretation of the indices root mean square error of approximation (RMSEA < .05) was used. Goodness of the fit index (GFI ) greater >.90 (Joreskog &Sorborn, 1989) and Comparative fit index (CFI)>.90 (Bentler, 1990) were used.
Figure 1
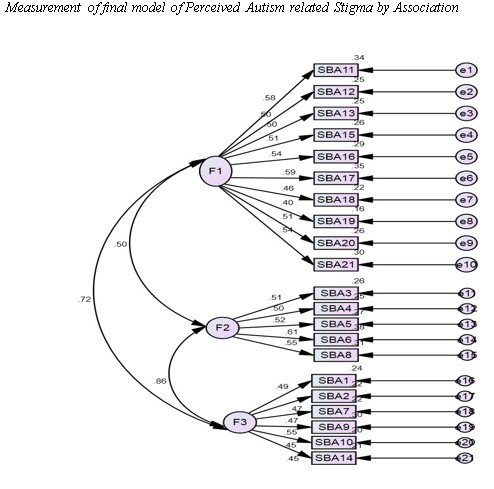
Figure 1 is reporting findings for three factors structure of Perceived Autism Related Stigma by Association Scale. Results support the distinctiveness of above 3 sub scales and items loading on them. Factor loadings of items are in their minimum range = .40.
Table 5
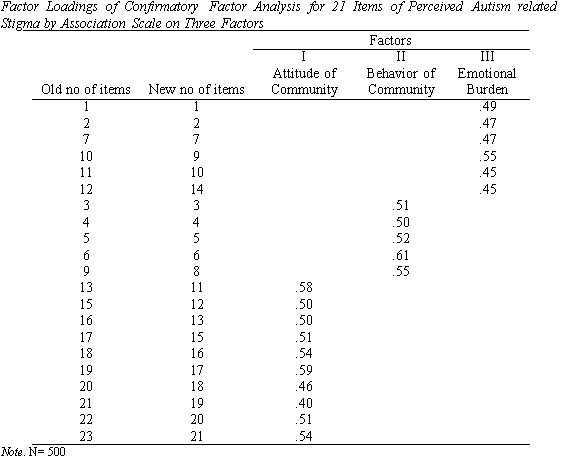
Table 6
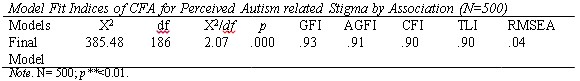
Table 5, 6 and Figure 1 represent the findings of factor loading and model fit indices of CFA for Perceived Autism related Stigma by Association Scale. The initial criteria for the item loading is >.35, the model obtained through EFA was examined in CFA, where 2 items (8 and 12) were deleted due to low factor loading and overall factor structure showed good model fit. The final obtained model consists of 21 items which reveals a good model fit (chi-square = 385.4 (df =186); p = .000; chi-square/df= 2.07; RMSEA =.046; GFI =.93; CFI = .90; TLI = .89). Generally, a good model fit requires a non-significant chi-square; however when dealing with a large data set, the value of chi-square is nearly always significant. In such cases, Hatcher (1996) suggests that a model that has a value less than 3, when the value of chi-square is divided by the degrees of freedom, is a good fit. So, value of X2/df = 2.07, which comes under the acceptable range. Further, RMSEA should be below .05, which shows a good fit model and in recommended range.
Table 7
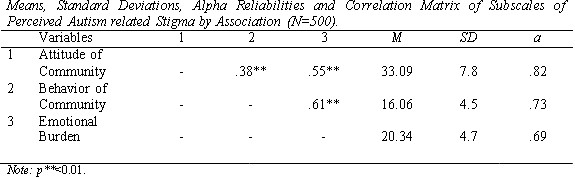
Table 7 represents the Cronbach alpha of the subscale of the scale ranges from .69 to .82. Further, the Pearson’s product moment coefficient of correlation was run and it shows a significant positive relationship between the subscales of Perceived autism related stigma by association (r= .38**, r= .55**, r=.61**, p<0.01).
Table 8
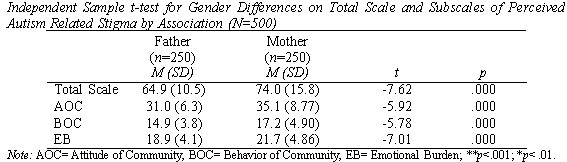
Table 8 shows results of Independent sample t- test analysis. Mothers score higher on all sub scales and total scale of Perceived autism related stigma by association( Attitude of community(M (SD)= 35.11(8.77), t=-5.92, p<.001; Behavior of community (M(SD)= 17.20 (4.90), t= -5.78, p< .001; Emotional burden (M(SD)= 21.75(4.86), t= -7.01, p< .001 and total scale of PARSBA (M(SD)= 74.0 (15.8), t= -7.62, p< .001) as compare to fathers (Attitude of community(M (SD)= 31.06(6.31); Behavior of community (M(SD)= 14.92 (3.85); Emotional burden (M(SD)= 18.92(4.13) and total scale of PARSBA (M(SD)=64.9(10.5). So results show that mothers experience higher Autism related perceived stigma by association as compared to fathers.
Study II: Convergent (Construct validity) and Discriminant Validity of the ScaleStudy II was aimed to establish the discriminant and convergent validity of the scale. For convergent validity, Perceived Stigma Scale for Intellectual Disability (Ali et al., 2008) and for discriminant validity Rosenberg Self-esteem Scale (Rosenberg, 1965) was used. Convergent validity is usually accomplished by signifying a correlation between the two measures which should be positively correlated with each other. Sometimes claimed correlation coefficient should be above .50 and recommended at above .70 (Carlson &Herdman, 2012). Conversely, discriminant validity supposed to show negative relationship and no correlation at all. Hypotheses
A purposive sample of (N=60) with equal distribution of both parents (30 mothers and 30fathers) was recruited by using snow ball technique. The parents were contacted and approached in person. Permission was taken and time was fixed with both parents for administrating the scales. Parents who had at least one child with ASD and were living together were included in the study.
Instruments
Perceived Autism Related Stigma by AssociationPerceived Autism Related Stigma by Association Scale developed in Study 1 consists of 21 items. It measures Attitude of Community (11, 12, 13, 15, 16, 17, 18, 19, 20, 21), Behavior of Community (3,4,5,6,8) and Emotional Burden (1,2,7,9,10, 14) in the context of stigma faced by the parents for having a child with Autism spectrum disorder. A 5 points Likert format was used for rating 1= strongly disagree, 2= disagree, 3=neutral, 4= agree and 5= strongly agree. The scale has shown an excellent alpha level =.87.
Perceived Stigma ScaleThe Perceived Stigma Scale consists of 10 items (Ali et al., 2008). It contains 2 factor: Perceived Discrimination(1,2,3,4,5,6) and Reaction to Discrimination (7,8,9,10). Items rated on five point Likert scale (1 = strongly disagree, 2= disagree, 3=neutral, 4= agree and 5= strongly agree). The scale has shown an excellent alpha level = .84.
Rosenberg Self-Esteem ScaleIt is consists of 10 items rated on a four-point scale (1 = strongly disagree, 2= disagree, 3= agree and 4= strongly agree). It measure both positive and negative feelings of person self- worth. Items include: ‘on the whole, I am satisfied with myself’, ‘I feel I don’t have much to be proud of’ etc. Item no 2, 5, 6, 8 and 9 were scored reverse. The scale revealed to have a good alpha level =.77.
ProcedureFor the validation of the indigenous developed Perceived Autism Related Stigma by Association Scale, 30 parents were approached living together and have a child with ASD, age ranged from 4-12 years old with no other co morbidities and already diagnosed, were contacted in person. Permission was taken and time was fixed with both parents for administrating the scale. After that, consent form was signed and the parents were briefed about the purpose of the study and assured that their responses would be kept confidential. There was no time limit to fill the questionnaires and it took 15 to 25 minutes to read and respond to the items of scale. Further, they were told that there was no right or wrong answers. Obtained data were statistically analyzed via SPSS 21.0 version.
Results
For establishing convergent and discriminant validity, Pearson’s product moment correlation was calculated.
Table 9
Table 9 represents the findings of correlation among the newly constructed scale, Perceived Stigma Scale and Self-esteem Scale for the convergent and discriminant validity for indigenous developed Perceived Autism Related Stigma by Association Scale. The results reveal that Perceived Stigma significantly positively correlate with Perceived Autism Related Stigma by Association (r= .76**) and with its sub scales (Attitude of community(r=.60**), Behavior of community(r=.90**) and Emotional burden (r=.59**).
On other hand, Self-esteem significantly negatively correlates with Perceived Autism related Stigma by Association (r= -.21*) and with its sub scales: Attitude of community (r= - .17*), Behavior of community (r= -16*) and Emotional burden of parents (r= -.22*). It reveals that the construct of newly constructed indigenous scale has good convergent and discriminant validity.
Discussion
The current study was carried out to fill the research gap by developing a valid and reliable measure of Perceived Autism Related Stigma by Association for parents of children with ASD. Though qualitative studies have reported experiences of stigma by association among parents of children with ASD (e.g., Liao et al., 2019; Vander-Sanden et al., 2015) but there was no evidence of quantitative measure of autism related stigma by association. The scale was developed by using both qualitative and quantitative approaches.
The scale was developed by following both inductive and deductive approaches. The final scale after EFA, CFA and reliability analysis (see Table 5-7) comprised 21 items. The results suggest that Perceived Autism Related Stigma by Association Scale is a valid and reliable measure for measuring stigma by association among the parents having a child with ASD in Pakistan.
Three factors emerged in EFA and validated in CFA were named Attitude of Community, Behavior of Community, and Emotional Burden. Having a child with ASD led parents toward stigmatization and rejection from society, which later on put them under stress and isolation. Content of Factor 1 (Attitude of Community) is correspondingly linked to Siperstein et al. (2007) findings, in which he reported that community had very negative perception toward parents having a child with ASD. People believe that that parents have done something wrong, that is why they are having a child with disability. Content of Factor 2 (Behavior of Community) is consistent with Calzada et al.’s (2012) findings that community debarred the ASD children in school with teasing and unkindness. In fact, people start character assassination and discriminate parents for having a child with ASD, which later on lead them toward lower self-esteem, depressive symptoms, anxiety, withdraw from social situations and even isolation to conceal their status from others (Corrigan &Wassel, 2008). This rejection, devaluation and poor support affect the child and family and cause painful emotions and feelings for life time. The content of Factor 3 (Emotional Burden) is consistent with Goffman (1963) and Yanos (2018; p.136) findings that the impact of negative stereotypes and behaviors of community affect family members and they suffer from feelings of inferiority, helplessness, self-blaming and emotional pain for life time and it is irreversible.
Further, gender difference among parents in experiencing stigma by association was also measured and the results showed significant differences (see Table 8). The results are consistent with the previous studies that revealed mother as more prone to be stigmatized than father. Mothers are blamed for the onset of autism, and it is expected that they should be ashamed and be avoided and pitied (Milacic-Vildojevic et al., 2012).
For validation of the scale, convergent and discriminant validity was established to ensure the construct validity with the help of existing scales. Perceived Stigma Scale was used to check the relevance of the Perceived autism related stigma by association scale. The findings revealed that overall scale and the subscales of PARSBA positively correlated with Perceived Stigma Scale. Literature on stigma by association and perceived stigma showed that both variables contribute to psychological distress among family members of individual with disability or with mental illness (Larson & Corrigan, 2008; Pryor et al., 2012; Vander-Sanden et al., 2013). On other hand, Rosenberg self-esteem scale was used to check the discriminant validity of scale and the results showed that scores on our newly developed scale had significant positive correlations with scores on Stigma Scale and significant negative correlation with scores on Self-esteem Scale (see Table 9). Most of studies have reported that due to self-stigma, stigma by association or perceiving internalized stigma, the individual with the issue of mental health or having a member with mental illness and disability suffer from significantly lower self-esteem. Correlations between scores on Perceive Autism Related Stigma by Association and self-esteem were significant but not very strong (see Table 9) and the results are in line with studies on stigma and self-esteem that reported relatively small negative relationship between both variables (e.g., Cantwell et al., 2015; Dwyer et al., 2013; Link et al., 2001; Maharjan & Panthee, 2019). The findings confirmed the validity of indigenously developed Perceive Autism Related Stigma by Association scale to be used to assess stigma by association in parents of children with ASD in future.
ImplicationsThis scale will help the mental health professionals to assess stigma by association in parents of children with ASD. Disability and public reaction put negative effects on the lives of family members, especially parents which is usually neglected while dealing with the mental health issues of caregivers of the persons with disabilities. The construction of this scale will promote research on the determinants and consequences of stigma by association among the parents of children with ASD.
Limitations and SuggestionsData were collected from one province of Pakistan, so for further validation of the scale, data should also be collected from other three provinces of the country to get larger and more representative sample of parents of children with ASD. Parents living only in the urban areas were included in the present studies, a comparative analysis of parents of children with ASD in rural and urban areas will also give directions for future researches. The scale needs to be validated in other countries, so that scores on stigma by association across different cultures may be examined.
ConclusionThe results of EFA, CFA, and reliability analysis and construct validity demonstrate that the newly constructed scale has promising psychometric properties and we can confidently use it for future studies. Results also indicate that stigma by association experienced by the parents of children with ASD may be divided in three domains (viz., Attitude of community, Behavior of community, and Emotional burden).
References
Ali, A., Hassiotis, A., Strydom, A., & King, M. (2012). Self-stigma in people with intellectual disabilities and courtesy stigma in family careers: a systematic review. Research in Development Disabilities. 33(6), 2122-40. https://doi.org/10.1016/j.ridd.2012.06.013.
Austin, J. K., MacLeod, J., Dunn, D. W., Shen, J., & Perkins, S. M. (2004). Measuring stigma in children with epilepsy and their parents: Instrument development and testing. Epilepsy & Behavior, 5(4), 472-482. https://doi: 10.1016/j.yebeh.2004.04.008
Boyd, R. J., Otilingam, G. P., &Grajales, M. (2003). Internalized stigma of mental illness: Psychometric properties of a new measure. Psychiatry Research, 121(1), 31-49.
Braun, V., & Clarke, V. (2006). Using thematic analysis in psychology. Qualitative Research in Psychology, 3(2), 77-101.
Brohan, E., Clement, S., Rose, D., Sartorius, N., Slade, M., & Thornicroft, G. (2012). Development and psychometric evaluation of the discrimination and stigma scale. . Psychiatry Research, 208(1) 33-40. https://doi.org/10.1016/j.psychres.2013.03.007.
Byrne, P. (2000). Stigma of mental illness and ways of diminishing it. Advances in Psychiatric Treatment, 6(1), 65-72. https://doi.org/10.1192/apt.6.1.65.
Cantwell, J., Muldoon, O., & Gallagher, S. (2015). The influence of self-esteem and social support on the relationship between stigma and depressive symptomology in parents caring for children with intellectual disabilities. Journal of Intellectual Disability Research, 59(10), 948–957. https://doi.org/10.1111/jir.12205.
Corrigan, P.W. & Watson, A.C. (2002). Understanding the impact of stigma on people with mental illness. World Psychiatry, 1(1), 16-20.
Corrigan, P. W., Watson, A. C., & Miller, F. E. (2006). Blame, shame, and contamination: The impact of mental illness and drug dependence stigma on family members. Journal of Family Psychology, 20(2), 239-246.
Dimitropoulos, G., Carter, J., Schachter, R., & Woodside, D. B. (2008). Predictors of family functioning in careers of individuals with anorexia nervosa. International Journal of Eating Disorders, 41(8), 739-747. https://doi: 10.1002/eat.20562.